Cloud Run health checks are probes that test whether an instance can serve. Every service gets one by default: a TCP connection to the port, one attempt, 240 seconds to succeed. It proves the port is open, not that the app can answer, and nothing checks the instance again. You can add an HTTP startup probe, a liveness probe for hangs and a readiness probe for trouble that passes.
In short
- The default startup probe is one TCP attempt with 240 seconds to connect; our 643 instance starts passed it with a median of 0.59 seconds.
- A startup probe you set may wait up to 600 seconds (1,800 with GPUs), but fields left out default to a 10-second period and 3 failures, a 30-second window.
- A liveness probe kills the instance with
SIGKILLand a 503 for its requests; a readiness probe stops new requests and resumes after 2 passes. - A liveness probe with a 10-second period and 3 failures kills a silent instance after about 30 seconds; keep the database out of it.
- A liveness probe every 10 seconds costs at most $0.66 a month; one warm minimum instance costs $9.86, and ten uptime checks a minute $94.20.
Prices are europe-west1 list prices for 1 vCPU and 512 MiB, read on October 12, 2026.
What Cloud Run checks by default
When a container starts, Cloud Run tries to open a TCP connection to the port in PORT, 8080 unless you change it. The probe it sets up when you configure none is timeoutSeconds: 240, periodSeconds: 240, failureThreshold: 1: one attempt, four minutes to connect. Once the port accepts a connection, the instance counts as started and gets requests "as soon as it is listening", in the container contract's words.
Two rules come with it. The server must listen on 0.0.0.0, not 127.0.0.1, or the probe never reaches it. And it must listen within 4 minutes. When it does not, the deploy fails with the error most people meet on their first day: "Container failed to start. Failed to start and then listen on the port defined by the PORT environment variable."
A deploy waits for this check: gcloud run deploy starts one instance of the new revision and waits for its startup probe (--deploy-health-check, on by default). If the probe fails, the revision gets no traffic and the old one keeps serving. Leave it on; revisions, traffic splitting and rollbacks covers the way back from a revision that passes and still fails.
There is no liveness or readiness probe by default. After an instance has started, Cloud Run does not check it again.
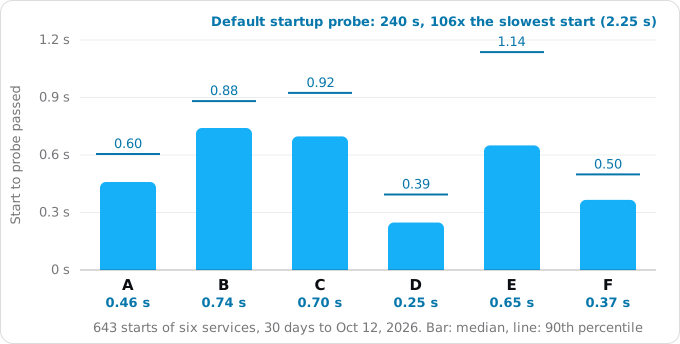
Exodus team: all eight services in our own project run exactly this default. Over 30 days their Cloud Run logs show 643 instance starts on the six services that started 10 times or more. The time from "Starting new instance" to "Default STARTUP TCP probe succeeded" had a median of 0.59 seconds and a slowest start of 2.25 seconds, and every probe passed on its first attempt.
What the default misses
A TCP probe proves that something in the container accepts connections on the port, not that the app behind it can answer. Our sample in docs/research/blog/health-checks-and-startup-probes/sample/ shows the two gaps this leaves. It probes containers in Docker the way Cloud Run would: a TCP connect, and an HTTP GET that gives up after 1 second, the default probe timeout.
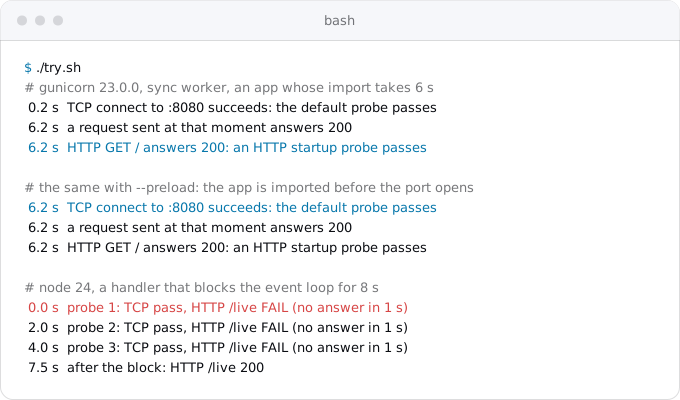
Listening is not the same as ready. Gunicorn's master process opens the port first, then forks workers, and each worker imports your app. In the sample the import takes 6 seconds, the way loading a model, a large config or a cache does. The port accepted connections at 0.2 seconds, so the default probe would pass there, and a request sent at that moment waited until 6.2 seconds for its answer. On Cloud Run that is a user's request, and the wait adds to the cold start. Worse, an app that opens its port and then fails to initialize, say on a wrong database password, still passes the probe: the deploy succeeds, traffic moves, and every request gets a 500.
A hung process still accepts connections. The kernel accepts TCP connections on a listening socket even when the program behind it is stuck. In the sample, a Node handler blocks the event loop for 8 seconds; three TCP checks passed while three HTTP checks got no answer. On Cloud Run, with no liveness probe, an instance in that state stays in service.
The cheapest fix for the first gap is to open the port last. For gunicorn, --preload loads "application code before the worker processes are forked", and in the sample the port then opened at 6.2 seconds, when the app could answer. The migrations guide shows the other side of it: work done before the port opens counts against the startup probe.
Three probes
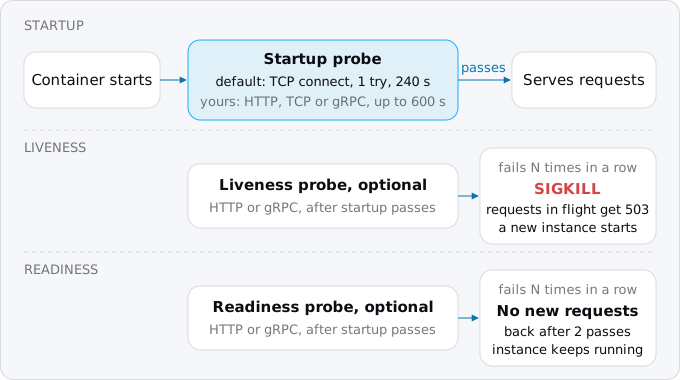
Probes are set per container, and a change creates a new revision. An HTTP probe sends a GET over HTTP/1, and any 2xx or 3xx status is a success. A gRPC probe calls grpc.health.v1.Health/Check, gRPC's standard health checking protocol.
Startup probe. Decides when the instance has started. TCP, HTTP or gRPC. It retries every periodSeconds up to failureThreshold times; that window can be at most 600 seconds (1,800 with GPUs), and when it runs out the container is shut down. The other two probes wait for it. Google's container contract still says an instance must listen within 4 minutes, so plan for that anyway.
One trap: in a startup probe you set yourself, the fields you leave out take the general defaults, a period of 10 seconds, 3 failures and a 1-second timeout. That is a 30-second window, not 240. Always set periodSeconds and failureThreshold.
Liveness probe. Decides whether to restart the instance. HTTP or gRPC. When it fails failureThreshold times in a row, Cloud Run kills the container with SIGKILL, ends its running requests with a 503, and starts a new instance. Google says liveness probes are "intended to restart individual instances that can't be recovered in any other way", such as "a deadlock where a service is running, but is unable to make progress". After repeated failures, Cloud Run limits restarts to avoid a crash loop.
Readiness probe. Decides whether the instance gets new requests. HTTP or gRPC. When it fails failureThreshold times, Cloud Run stops sending new requests to the instance without stopping it, and resumes after successThreshold passes in a row, 2 by default. Session affinity overrides it, and a service that set one through the older v1 API before November 2025 must deploy once without it and once with it. A new instance can get traffic before its first readiness check, so Google asks that "passing the startup probe also ensures readiness".
What it costs
Health checks barely show on a bill; slow starts and extra instances do. On request-based billing, the default, Cloud Run charges CPU and memory while an instance starts, shuts down or serves requests. Probes are "billed for CPU and memory usage consumption" with no request fee. The model is one vCPU and 512 MiB in europe-west1 at 2026-10-12 list prices: $0.00002525 a second while active ($0.000024 per vCPU-second, $0.0000025 per GiB-second), $0.00000375 for an idle minimum instance.
- A liveness probe every 10 seconds on one instance all month: 262,800 probes. No page says how a probe is rounded; billed as a full 100 ms each, at most $0.66.
- One uptime check every minute from three regions: 131,400 executions. The first million per project are free: $0.00, and seven such checks fit.
- 3,000 cold starts of 20 seconds: $1.52; at our half-second median, $0.04. Startup CPU boost, on by default for new services, doubles one vCPU to two during startup and for 10 seconds after, and bills the doubled CPU.
- One minimum instance kept warm all month to hide a slow start: $9.86 at the idle rate.
- Ten uptime checks every minute from three regions: 1,314,000 executions, 314,000 past the free million at $0.30 per 1,000: $94.20, the figure in Google's own pricing example.
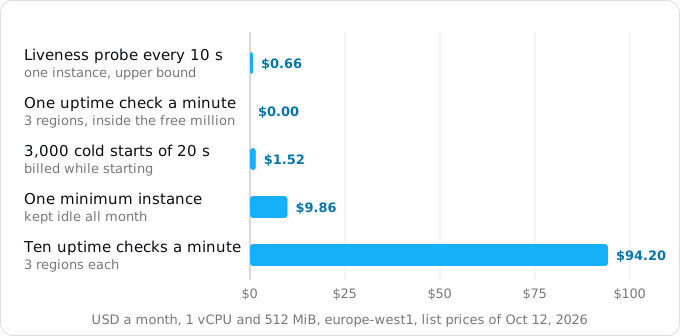
The expensive mistake is not on the chart: a liveness probe that fails under load kills instances that were only busy, and each kill is a cold start plus a 503 for every request on the instance.
Step 1. See what your service does today
Read the probe settings of a service. With the default, this prints the 240-second TCP probe and nothing for the other two:
gcloud run services describe SERVICE --region REGION \
  --format='yaml(spec.template.spec.containers[0].startupProbe,spec.template.spec.containers[0].livenessProbe,spec.template.spec.containers[0].readinessProbe)'
Cloud Run writes every probe result to the service's logs. This read-only command lists the last day's:
gcloud logging read \
  'resource.type="cloud_run_revision" AND resource.labels.service_name="SERVICE" AND textPayload:"probe"' \
  --freshness=1d --limit=20 --format='value(timestamp,severity,textPayload)'
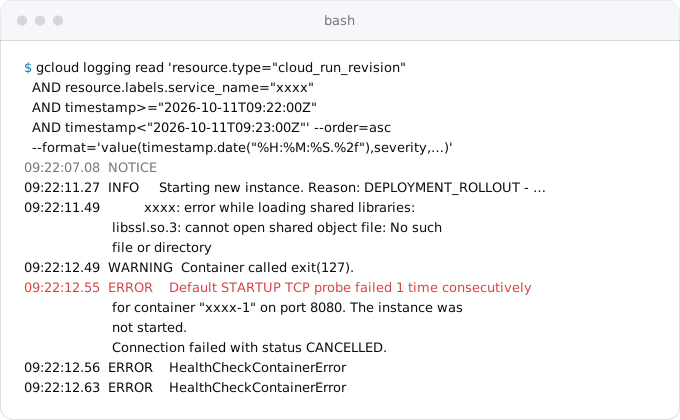
"Default STARTUP TCP probe succeeded after 1 attempt" is the normal line. A failure reads "Default STARTUP TCP probe failed 1 time consecutively ... The instance was not started", and the lines just before it say why. The startup.sh script in this guide's research notes turns these lines into startup times like the chart above.
Exodus team: here is one of our own failed deploys. The binary needed a library its runtime image did not have, exited with code 127 about a second after the instance started, and the default probe failed about 70 milliseconds later. The deploy health check marked the revision not ready, and the previous revision kept serving:
Google's troubleshooting page lists the usual causes: the wrong port, listening on 127.0.0.1, a crash at startup, and a secret the service account may not read.
Step 2. Make "started" mean "ready"
First, open the port last. Load the config, connect the pool, warm the cache, then listen. In Node, call server.listen() after the setup has finished. With gunicorn, --preload imports the app before the port opens, as the sample showed. Then the default TCP probe means what you want, and you need nothing else.
When a framework opens the port early and you cannot change it, add an HTTP startup probe on an endpoint that answers 503 until the app is ready:
let ready = false;
app.get("/ready", (req, res) => res.sendStatus(ready ? 200 : 503));

app.listen(Number(process.env.PORT ?? 8080), "0.0.0.0");
await loadEverything();
ready = true;
Then point the probe at it. This gives the app 24 attempts, 5 seconds apart, a 120-second window, and 3 seconds per attempt:
gcloud run services update SERVICE --region REGION \
  --startup-probe=httpGet.path=/ready,periodSeconds=5,failureThreshold=24,timeoutSeconds=3
Some frameworks already have an endpoint. Rails 7.1 and later answers /up with 200 when the app booted without exceptions and 500 otherwise. Spring Boot's Actuator serves /actuator/health/liveness and /actuator/health/readiness.
Three rules for the path:
- Do not end it in `z`. Cloud Run reserves "some paths ending with z" and recommends "avoiding all paths that end in z", so
/healthz, a common name and the one the Rails docs use as their example for renaming/up, can collide. Paths starting with/_ah/are reserved too. Use/health,/readyor/live. - It is public. Google: health check endpoints "are externally accessible". Anyone can call it, so return a status and no details, and keep it cheap.
- It runs like any other request. It shares the instance's concurrency, CPU and server workers with real requests, and is timed out after
timeoutSeconds, 1 second by default.
If the app is slow to start and will stay slow, a minimum instance keeps one warm, at the $9.86 a month above, as min instances and startup CPU boost explains; the cold start guide covers the other ways to shorten the wait.
Step 3. Add a liveness probe only for hangs
A process that crashes needs no probe: Kubernetes' docs make the point that a container which exits on failure is already handled. A liveness probe is for an app that hangs without crashing: a deadlock, a stuck event loop, a thread pool that never frees a thread. If yours never does that, skip it.
If it does, give it its own endpoint that checks only the process itself:
app.get("/live", (req, res) => res.sendStatus(200));If that handler answers, the server is alive. Do not check the database, Redis or another API here. Spring Boot's docs: the liveness probe "should not depend on health checks for external systems", because when the database fails, every instance fails its probe and all restart at once; Kubernetes' docs warn of "cascading failures". On Cloud Run that means every instance killed together, a 503 for every request in flight, and a wave of cold starts against a database that is already down.
Then set it with room to be busy:
gcloud run services update SERVICE --region REGION \
  --liveness-probe=httpGet.path=/live,periodSeconds=10,failureThreshold=3,timeoutSeconds=3
That kills an instance after about 30 seconds of silence. Raise timeoutSeconds above the default 1 second, because a busy instance can be slow to answer one more request. And check your server's workers: a gunicorn sync worker "handles a single request at a time", so with one sync worker the probe waits behind a long request and fails, and Cloud Run kills the instance in the middle of that request. Run gunicorn with threads, as the long requests guide explains, before you add a liveness probe.
Step 4. Add a readiness probe for trouble that passes
A readiness probe fits an instance that can be unable to serve for a while and then recover on its own: a local cache rebuilding, a connection pool exhausted, a model being swapped. The instance stops getting new requests and keeps its process, instead of being killed:
gcloud run services update SERVICE --region REGION \
  --readiness-probe=httpGet.path=/ready,periodSeconds=10,failureThreshold=3,successThreshold=2,timeoutSeconds=3
Be as careful with shared dependencies here as in liveness. If /ready checks the one database every instance uses, a database outage makes every instance unready together, and Cloud Run has nowhere to send requests. Spring Boot's docs leave external checks in readiness to the developer and include none by default. Check what belongs to the instance; let requests fail with a clear error when a shared dependency is down.
Readiness also feeds Cloud Run service health: a region counts as healthy when 60% or more of its instances pass, and a global load balancer moves traffic away from an unhealthy region. It needs the service in two or more regions behind a load balancer, Google's tutorial deploys it with minimum instances, and it costs nothing beyond the probes.
Step 5. Check from outside
Probes run next to the container and do not see your domain, its certificate or a load balancer in front. A load balancer has no health checks of its own here: they "are not supported for serverless backends", and Google offers outlier detection (the balancer stops sending to a backend that returns too many errors) or service health (Step 4) instead.
For the path a user takes, add a Cloud Monitoring uptime check. This checks /health over HTTPS every 5 minutes from three regions:
gcloud monitoring uptime create "SERVICE health" \
  --resource-type=uptime-url --resource-labels=host=HOST,project_id=PROJECT_ID \
  --protocol=https --path=/health --period=5 --regions=europe,usa-iowa,usa-oregon --timeout=10
HOST is your domain or the service's run.app host. A check needs at least three regions; with no --regions it runs from all six checkers, which doubles the executions. At a 5-minute period one check is 26,280 executions a month, well inside the free million. An uptime check only records results; to be told, attach an alerting policy to it, billed at $0.35 a month per metric it references; logs, metrics and alerts for a Cloud Run app has that policy as a file.
Coming from another platform
- Heroku: the 60-second limit to bind
$PORT(error R10) becomes the 240-second TCP probe. Nothing to change unless the app took longer than that. - Render and Railway: the health check path becomes an HTTP startup probe on the same path. Render without a path waits for the port, like Cloud Run's default. Railway waits up to 300 seconds by default; set
periodSecondstimesfailureThresholdto cover your real start. - Fly.io: HTTP checks under
http_service.checks, which take a machine out of routing, become a readiness probe. - Kubernetes: the field names are the same; an
execprobe, which runs a command in the container, becomes an HTTP endpoint. - A Dockerfile `HEALTHCHECK`: Cloud Run probes are set on the service, not in the image, so carry the command over as an HTTP probe.
- Jobs and worker pools: jobs have startup probes only and worker pools have startup and liveness, both with a 240-second window at most. The services, jobs and worker pools guide explains the three.
- Sidecars: a container that others start after needs a startup probe, or the start order means nothing; the Docker Compose guide covers
depends_on.
What breaks
- The port opens before the app is loaded: requests wait, or a broken app passes its deploy.
- A startup probe set with only a path: a 30-second window instead of 240.
- A health path ending in `z`:
/healthzmay hit a reserved path. - A liveness probe that checks the database: every instance restarts during a database outage.
- A 1-second probe timeout on a busy instance, or a single gunicorn sync worker: healthy instances are killed.
Checklist
- Read the probe settings and the last day's probe logs (Step 1).
- Open the port after the app is ready, or add an HTTP startup probe with an explicit period and threshold (Step 2).
- Use
/health,/readyor/live, never a path ending inz, and return no details. - Add a liveness probe only if the app can hang; check only the process, and give it a timeout above 1 second (Step 3).
- Add a readiness probe only for trouble an instance recovers from, without shared dependencies (Step 4).
- Add an uptime check on the public URL with an alert (Step 5).
- Leave the deploy health check on.
Where Exodus comes in
Exodus's CLI reads your repository with your coding agent and lists what the move to Cloud Run's health checks touches, with file and line: the health check path in a Render, Railway or Fly config, a Kubernetes probe, a Dockerfile HEALTHCHECK, a /healthz route, a server that listens on 127.0.0.1 or opens its port before loading the app, a gunicorn command without threads. Each becomes a finding in the report with the probe flags to set and this guide as the explanation.
FAQ
Does Cloud Run have a health check by default?
Yes, one: a TCP startup probe on the port in PORT, 8080 unless you change it, with one attempt and 240 seconds to connect. Once the port accepts a connection, the instance gets requests. There is no liveness or readiness probe by default, so after an instance has started, Cloud Run does not check it again.
Why does a Cloud Run deploy fail with "Container failed to start"?
The default startup probe could not connect to the port. The usual causes on Google's troubleshooting page are the wrong port, a server listening on 127.0.0.1 instead of 0.0.0.0, a crash at startup, and a secret the service account may not read. The deploy health check gives the new revision no traffic, so the old one keeps serving.
Should a liveness probe check the database?
No. When the database fails, every instance fails its liveness probe and Cloud Run kills them all together: a 503 for every request in flight and a wave of cold starts against a database that is already down. A liveness endpoint should check only that the process itself answers.
Can I use /healthz as a health check path on Cloud Run?
Better not. Cloud Run reserves some paths ending with z and recommends avoiding all of them, so /healthz can collide with a reserved path. Paths starting with /_ah/ are reserved too. Use /health, /ready or /live, and return a status with no details, because the endpoint is public.
How much do health checks cost on Cloud Run?
Cents. Probes are billed for CPU and memory with no request fee: a liveness probe every 10 seconds on one instance costs at most $0.66 a month in europe-west1. Uptime checks are free for the first million executions per project a month, then $0.30 per 1,000.
Sources
26
- docs.cloud.google.comConfigure container health checks for services, Cloud Run
- docs.cloud.google.comContainer runtime contract, Cloud Run
- docs.cloud.google.comTroubleshoot Cloud Run issues
- docs.cloud.google.comCloud Run known issues
- docs.cloud.google.comgcloud run deploy reference, Google Cloud SDK
- docs.cloud.google.comDeploy a Cloud Run function, Cloud Run
- docs.cloud.google.comConfigure CPU limits for services, Cloud Run
- cloud.google.comCloud Run pricing, Google
- docs.cloud.google.comConfigure containers for services, Cloud Run
- docs.cloud.google.comConfigure container health checks for jobs, Cloud Run
- docs.cloud.google.comConfigure container health checks for worker pools, Cloud Run
- docs.cloud.google.comAutomate cross-region failover with Cloud Run service health
- cloud.google.comMaking highly available, multi-region Cloud Run services just got easier, Google Cloud blog
- docs.cloud.google.comServerless network endpoint groups overview, Cloud Load Balancing
- docs.cloud.google.comCreate public uptime checks, Cloud Monitoring
- cloud.google.comGoogle Cloud Observability pricing
- kubernetes.ioLiveness, Readiness, and Startup Probes, Kubernetes docs
- docs.spring.ioEndpoints, Spring Boot docs
- api.rubyonrails.orgRails::HealthController, Rails API
- grpc.ioHealth checking, gRPC docs
- docs.gunicorn.orgSettings and Design, gunicorn docs
- devcenter.heroku.comDyno startup behavior, Heroku Dev Center
- render.comHealth checks, Render docs
- docs.railway.comHealthchecks, Railway docs
- docs.fly.ioHealth checks, Fly.io docs
- Exodus team: probe settings of eight services, 643 instance starts and one failed deploy read from our own project's Cloud Run logs