Cloud Run logs every request and every line a container prints, and keeps metrics on requests, latency and instances, free, with no setup. It tells nobody when something breaks. Three alerting policies cover most outages of a small app: an uptime check on a health path, a threshold on 5xx responses, and a log match on entries at ERROR or above. A small app pays $0 for this.
In short
- Print one JSON object per line with
severityandmessage; alevelfield is not read, and 58 of 59 such entries of ours arrived with no severity. - Logs are free up to 50 GiB per project per month, then $0.50 per GiB, and are kept 30 days by default.
- The request log Cloud Run writes was 82% of what our services logged, about 770 bytes per request.
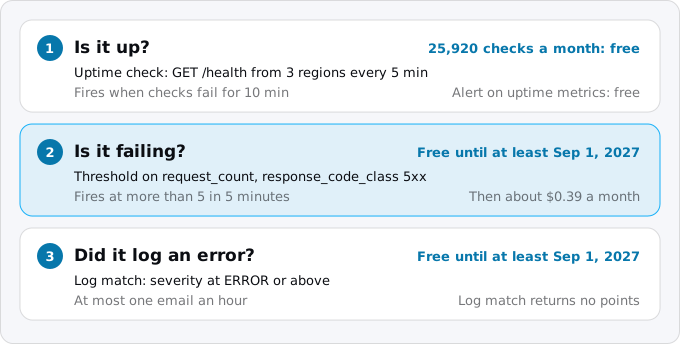
- The three alerts: an uptime check from 3 regions every 5 minutes, more than 5 responses 5xx in 5 minutes, and an error log match capped at one email an hour.
- Alerting is free until at least September 1, 2027; after that, a typical metric alert costs about $0.39 a month.
Prices are Google's list prices, read on October 12, 2026.
What Cloud Run collects without you
Google's logging page lists three kinds of logs that Cloud Run sends to Cloud Logging, Google's log store, on its own:
- Request logs. One entry per request to a service: method, URL, status, latency, size, user agent, the revision that answered. Cloud Run writes them; your code does not.
- Container logs. Whatever your code writes to stdout or stderr, to files under
/var/log, to syslog, or through Google's logging client libraries. Each entry is tagged with the service, the revision and the region. - System logs. Platform messages, under the log name
varlog/system. The useful ones say why an instance started:Starting new instance. Reason: AUTOSCALING,DEPLOYMENT_ROLLOUT, orMANUAL_OR_CUSTOMER_MIN_INSTANCE, the last from a minimum instances setting.
Cloud Monitoring, Google's metrics store, gets Cloud Run's metrics with "no setup or configuration required" and no charge. Error Reporting, also free, groups exceptions with a stack trace found in your logs, plus Cloud Run's "Memory limit exceeded" and "No instances available" errors. Cloud Trace gets the traces Cloud Run makes for requests, also at no charge.
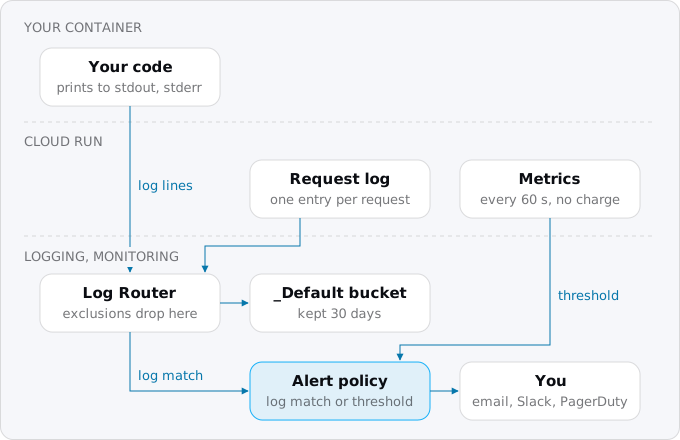
The Log Router decides where every entry goes. Each project has two buckets: _Required keeps audit logs of administrative actions for 400 days at no charge, and _Default keeps everything else for 30 days.
Write logs Google can read
Cloud Run looks at each line your container prints. A line that is a complete JSON object becomes a structured entry, jsonPayload, whose fields you can filter on. Any other line becomes textPayload, a string. A few JSON fields are taken out and used by Cloud Logging itself:
severity: the entry's level. UseDEBUG,INFO,NOTICE,WARNING,ERROR,CRITICAL. Without it, the entry has no severity, which the console shows as "Default".message: the text the console shows on the entry's line.logging.googleapis.com/trace: ties the line to the request it belongs to, so that the console nests your lines under the request log entry.
A request handler in Node.js that logs this way:
function log(severity, message, req, extra = {}) {
  const entry = { severity, message, ...extra };
  const header = req?.get("X-Cloud-Trace-Context");
  if (header && process.env.GOOGLE_CLOUD_PROJECT) {
    const [trace] = header.split("/");
    entry["logging.googleapis.com/trace"] =
      `projects/${process.env.GOOGLE_CLOUD_PROJECT}/traces/${trace}`;
  }
  console.log(JSON.stringify(entry));
}

log("ERROR", "payment failed", req, { orderId: 1042, code: "card_declined" });
Pass the project ID with --set-env-vars GOOGLE_CLOUD_PROJECT=my-project on deploy, or leave the trace out. In Python, print(json.dumps({...})) does the same; set PYTHONUNBUFFERED=1 so lines are not held in a buffer. Most logging libraries have a JSON output; check what they call the level field.
That last check matters more than it looks. Many libraries write the level as level, not severity. Cloud Logging does not read level, so every entry arrives with no severity, and a filter on severity>=ERROR finds nothing. We checked our own project, read-only:
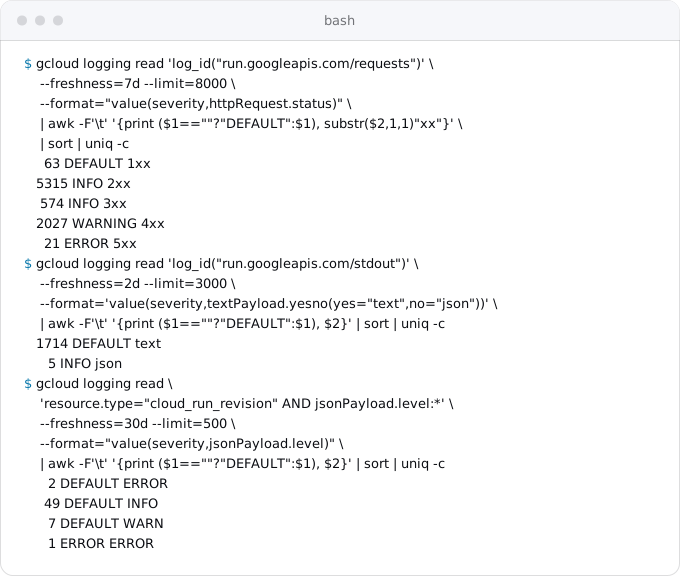
Exodus team: three things came out of it. Request logs carry a severity that follows the status: INFO for 2xx and 3xx, WARNING for 4xx, ERROR for 5xx, and none for WebSocket upgrades (101). Of 1,719 lines our services printed to stdout in two days, 1,714 were plain text with no severity. And one service logs JSON with a level field: 58 of its 59 entries had no severity, so our one alerting policy for it matches jsonPayload.level="ERROR" as well as severity>=ERROR. Fixing the field name in the logger is the better cure.
Read logs from the command line
The console's Logs tab shows request and container logs together. From a terminal:
gcloud run services logs read my-app --region europe-west1 --limit 50It reads the last day by default. To follow logs live, gcloud beta run services logs tail my-app works; Google marks it as Preview, and it installs the log-streaming component the first time.
For real queries, use gcloud logging read:
# errors of one service in the last hour
gcloud logging read 'resource.type="cloud_run_revision"
  AND resource.labels.service_name="my-app"
  AND severity>=ERROR' --freshness=1h --limit=50

# 5xx responses with their URLs
gcloud logging read 'resource.labels.service_name="my-app"
  AND httpRequest.status>=500' --freshness=1d \
  --format="value(timestamp,httpRequest.status,httpRequest.requestUrl)"
Your JSON fields are searchable as jsonPayload.orderId=1042; a colon means "contains", as in textPayload:"timeout". The same queries per release, filtered on resource.labels.revision_name, are in the guide on revisions, traffic splitting and rollbacks. Querying logs is not charged.
The metrics that matter
For a web app, six of Cloud Run's metrics answer most questions:
request_count: requests per revision, with labelsresponse_codeandresponse_code_class(2xx, 4xx, 5xx). Errors per minute come from here.request_latencies: milliseconds from the request reaching your container to the response, read as percentiles (p50 is the median, p95 the latency 95% of requests beat).container/instance_count: how many instances exist, broken down by state (active or idle).container/cpu/utilizationsandcontainer/memory/utilizations: how close instances run to their limits. Memory near 100% ends in "Memory limit exceeded" and a restarted instance.container/startup_latencies: how long new instances take to start, the cold start.container/billable_instance_time: the time you pay for.
Every name starts with run.googleapis.com/. Each is sampled every 60 seconds and visible after up to 120 seconds, so charts lag by two or three minutes. They are in the service's Metrics tab, or in Metrics Explorer under "Cloud Run Revision".
Two details in Google's metric list decide what an alert can see. request_count excludes requests that never reached an instance, for example unauthorized ones or those refused because the service hit its maximum number of instances; those appear only in the request log. And request_latencies does not include the time an instance takes to start, so a slow cold start shows in startup_latencies, not in latency.
Latency misleads on services that hold connections open. Exodus team: on one of our services that serves WebSockets, p95 latency in five-minute windows reached 3,855 seconds over a week, because a WebSocket "request" lasts as long as the connection. Leaving out the 101 responses still left 16 of 44 windows above one second, from long streams. A latency alert there would fire all day; watch 5xx and uptime instead (see WebSockets and SSE).
Three alerts for a small app
An alerting policy is a condition plus notification channels. The condition watches a metric (a threshold) or matches log entries (a log match). For a small app, three policies catch most outages:
Step 0: a notification channel
A channel is where alerts go: email, the Google Cloud mobile app, PagerDuty, SMS, Slack, webhooks, Pub/Sub or Google Chat. Google warns that delivery to SMS and Slack is not guaranteed. Start with email:
gcloud beta monitoring channels create \
  --display-name="On call (email)" --type=email \
  --channel-labels=email_address=oncall@example.com
gcloud beta monitoring channels list --format="value(name,displayName)"
The second command prints the channel's full name, which starts with projects/ and ends with the channel ID; the policies below need it. Send a test notification from the console to see that it is not filtered as spam.
Alert 1: is it up?
An uptime check requests a URL from Google's checkers in several regions and records whether it passed. It catches what the service cannot report itself: a broken domain, a crash loop, a deploy that serves nothing.
gcloud monitoring uptime create my-app-health \
  --resource-type=uptime-url \
  --resource-labels=host=my-app.example.com,project_id=PROJECT_ID \
  --protocol=https --path=/health --period=5 \
  --regions=europe,usa-oregon,usa-virginia
Per gcloud's help, a check needs at least three regions (default: all six), runs every 1, 5, 10 or 15 minutes (default 1), and times out after 60 seconds. For a private service, add --service-agent-auth=oidc-token. Avoid paths ending in z, such as /healthz, which Cloud Run reserves (see health checks and startup probes).
The command prints the check's name; its last part is the CHECK_ID. Then the alert, in a file alert-uptime.json, taken from Google's sample policy:
{
  "displayName": "my-app: health check failing",
  "combiner": "OR",
  "conditions": [{
    "displayName": "uptime check my-app-health fails",
    "conditionThreshold": {
      "filter": "metric.type=\"monitoring.googleapis.com/uptime_check/check_passed\" AND metric.label.check_id=\"CHECK_ID\" AND resource.type=\"uptime_url\"",
      "aggregations": [{"alignmentPeriod": "1200s",
        "perSeriesAligner": "ALIGN_NEXT_OLDER",
        "crossSeriesReducer": "REDUCE_COUNT_FALSE",
        "groupByFields": ["resource.label.*"]}],
      "comparison": "COMPARISON_GT", "thresholdValue": 1,
      "duration": "600s", "trigger": {"count": 1}
    }
  }],
  "notificationChannels": ["projects/PROJECT_ID/notificationChannels/CHANNEL_ID"]
}
It fires when more than one region reports a failure for ten minutes, so one checker's bad minute wakes nobody. Create it with gcloud monitoring policies create --policy-from-file=alert-uptime.json. Each check is a real request: three regions every five minutes make 25,920 a month, within Cloud Run's 2 million free requests.
Alert 2: is it failing?
The 5xx threshold watches request_count and fires when the service answers with server errors. Save as alert-5xx.json:
{
  "displayName": "my-app: 5xx responses",
  "combiner": "OR",
  "conditions": [{
    "displayName": "more than 5 responses 5xx in 5 minutes",
    "conditionThreshold": {
      "filter": "resource.type=\"cloud_run_revision\" AND resource.labels.service_name=\"my-app\" AND metric.type=\"run.googleapis.com/request_count\" AND metric.labels.response_code_class=\"5xx\"",
      "aggregations": [{"alignmentPeriod": "300s",
        "perSeriesAligner": "ALIGN_DELTA",
        "crossSeriesReducer": "REDUCE_SUM",
        "groupByFields": ["resource.label.service_name"]}],
      "comparison": "COMPARISON_GT", "thresholdValue": 5,
      "duration": "0s", "trigger": {"count": 1}
    }
  }],
  "alertStrategy": {"autoClose": "1800s"},
  "notificationChannels": ["projects/PROJECT_ID/notificationChannels/CHANNEL_ID"]
}
It sums 5xx responses of all revisions over five minutes and fires above 5. Pick the number from your own traffic. Exodus team: we ran this filter and aggregation over a week of our eight services, read-only; it would have fired twice, at 6 and 7 errors. A threshold of 0 would have fired in 10 windows. For a busy service, a ratio of 5xx to all requests is steadier; Google's sample policies show one with denominatorFilter.
Alert 3: did it log an error?
A log match fires on a single entry, which suits errors that do not end in a 5xx: a failed payment (see Stripe webhooks on Cloud Run), a job that gave up, an exception in a background task. Save as alert-errors.json:
{
  "displayName": "my-app: error in the logs",
  "combiner": "OR",
  "conditions": [{
    "displayName": "a log entry at ERROR or above",
    "conditionMatchedLog": {
      "filter": "resource.type=\"cloud_run_revision\" AND resource.labels.service_name=\"my-app\" AND severity>=ERROR"
    }
  }],
  "alertStrategy": {"notificationRateLimit": {"period": "3600s"},
    "autoClose": "1800s"},
  "notificationChannels": ["projects/PROJECT_ID/notificationChannels/CHANNEL_ID"]
}
notificationRateLimit caps notifications at one an hour, so a loop of errors sends one email, not a thousand. autoClose closes the alert after 30 minutes without matches (default 7 days, minimum 30 minutes). A log-based policy has one condition and cannot count; for "more than 10 errors a minute", create a log-based metric with gcloud logging metrics create and put a threshold on it. If your logger writes level, add OR jsonPayload.level="ERROR", as we had to. 5xx request logs are at ERROR too, so this policy also fires on server errors.
Create both with gcloud monitoring policies create --policy-from-file=FILE. To see a log match fire, Google's page points a policy at a test log and writes to it:
gcloud logging write test-log --severity=ERROR \
  --payload-type=text 'This log entry contains Oops'
When an alert arrives
Google's alerting page says most metrics become visible after about 60 seconds and policy computation adds up to 5 minutes 30 seconds, plus the channel's own delay: expect a metric alert two to seven minutes after a problem starts. Put the first command to run into the policy's documentation field, so the email carries it.
What it costs
List prices from Google's observability pricing page, read October 12, 2026:
- Logs: $0.50 per GiB written to a bucket, which includes 30 days of storage. The first 50 GiB per project per month are free. Reading and querying logs costs nothing, and the
_Requiredbucket costs nothing. - Keeping logs longer: $0.01 per GiB per month past 30 days.
- Cloud Run metrics: free. Your own metrics, including log-based metrics, are $0.2580 per MiB after the first 150 MiB per billing account; a counter point is 8 bytes, so one counter written every minute is about 0.33 MiB a month.
- Uptime checks: $0.30 per 1,000 executions after 1 million per project each month. One check every minute from all six regions is 259,200 executions; three such checks are free, a fourth makes the month $11.04.
- Alerting: free today. From no sooner than September 1, 2027, $0.35 a month per metric in a policy plus $0.50 per million points its query returns. A condition that returns one point every 30 seconds returns 86,400 points a month, $0.04, so alert 2 would cost about $0.39 a month. Policies on uptime metrics are not charged, and log-match conditions return no points.
The log line dominates, and inside it, the request log. Exodus team: over 30 days to October 12, 2026, our eight services handled 19,719 requests and wrote 17.7 MiB of logs; the request log was 14.5 MiB of it, about 770 bytes per request.
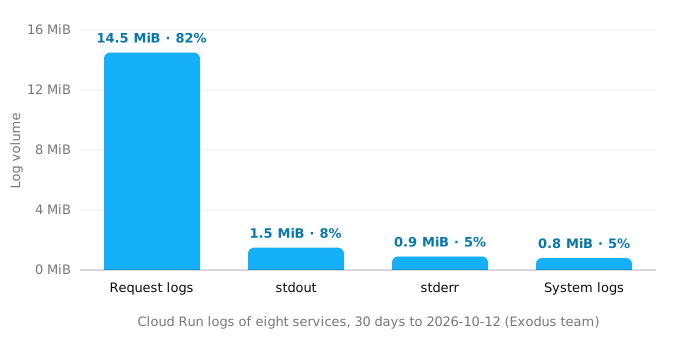
At 770 bytes a request, the free 50 GiB covers about 70 million requests a month, roughly 2.3 million a day, before your own lines. A worked example: an app with 100,000 requests a day writes about 2.15 GiB of request logs a month; with two lines of 200 bytes per request from your code, about 3.3 GiB. That is $0. At 3 million requests a day the request log alone is 64.6 GiB, so 14.6 GiB over the allowance, $7.30 a month.
Keeping the log bill down
Act only when the bill shows Cloud Logging growing (see budget alerts and the billing export).
Do not log every request yourself. Cloud Run already does. Exodus team: one of our services, a static site behind nginx, wrote an access line per request to stdout on top of Cloud Run's request log. Over 30 days its stdout was 0.86 MiB against 0.77 MiB of request logs, and nginx notices on stderr added 0.75 MiB, so it wrote about three times the log volume its requests alone needed. Turning off the access log in the server or the framework is a one-line change.
Exclude what you never read. A sink is a rule that sends matching entries to a bucket; _Default feeds the _Default bucket. An exclusion filter on it drops matching entries before they are stored, and you do not pay for them:
gcloud logging sinks update _Default --add-exclusion='name=health-checks,filter=log_id("run.googleapis.com/requests") AND httpRequest.requestUrl:"/health"'An exclusion can keep a share instead of dropping everything: sample(insertId, 0.9) matches about 90% of entries, so an exclusion with that filter keeps the other 10% (on our request logs, sample(insertId, 0.1) returned 461 of 4,929 entries). Log-based alerts do not see excluded entries, and the bucket never stores them, so never exclude warnings or errors.
Lower the noise at the source. DEBUG lines in production, whole request bodies, a stack trace per retry: log at INFO and above, with identifiers in fields.
What breaks
- An error alert never fires. Lines are plain text or use
level, so they have no severity. Log JSON withseverity, or matchjsonPayload.level. - Lines from one request are scattered. No trace field. Add
logging.googleapis.com/tracefrom theX-Cloud-Trace-Contextheader. - The latency alert fires all day. The service holds WebSockets or streams. Do not use a latency alert there.
- A 5xx alert stays quiet during an outage. Requests refused at the maximum number of instances never reach
request_count. Keep the uptime check, and read the request log. - An alert fires once and floods the inbox. A log match without
notificationRateLimit. Set it. - Alerts go to one person's inbox. They leave or filter it. Use a group address, and a second channel.
- The log bill grows with traffic. Your own access log duplicates Cloud Run's. Turn it off, then exclude or sample what you never read.
- Logs needed from two months ago are gone.
_Defaultkeeps 30 days. Raise its retention withgcloud logging buckets update _Default --location=global --retention-days=90, at $0.01 per GiB-month past 30 days.
A checklist
- Log one JSON object per line with
severityandmessage; check your library's field names. - Add the trace field, so that a request's lines are grouped.
- Create an email channel and send it a test.
- Add an uptime check on
/healthfrom three regions, and an alert on it. - Add the 5xx threshold and the error log match, each with the first command to run in its documentation.
- Have all three in place before the switch, as the cutover day checklist asks.
- Look at Cloud Logging in the bill once a month; exclude only what you never read.
Where Exodus comes in
Exodus does not install monitoring, and it does not sign in to your Google Cloud; your coding agent does that work, with your gcloud. What Exodus does after the move is exodus bill: it reads a month of your own bill from your billing export, read-only, grouped by service and SKU, so Cloud Logging and Cloud Monitoring appear next to Cloud Run, and with a linked account the cabinet sets the month against the report's estimate. The articles of this blog, this one included, are also what exodus kb and exodus ask read when your agent asks how to set up an alert.
FAQ
How long does Cloud Run keep logs?
30 days, in the _Default bucket that holds everything Cloud Run writes. Audit logs of administrative actions go to the _Required bucket and are kept 400 days at no charge. You can raise the retention of _Default; each GiB kept past 30 days costs $0.01 a month.
Why do my Cloud Run logs have no severity?
Cloud Logging reads the level from a JSON field named severity. Plain text lines, and JSON that calls the field level, arrive with no severity, which the console shows as Default, and a filter on severity at ERROR or above misses them. Log one JSON object per line with severity and message.
Are Cloud Run metrics free?
Yes. Cloud Run's own metrics, such as request count, latency, instance count, CPU and memory, need no setup and are not charged. Your own metrics, including log-based metrics, cost $0.2580 per MiB after the first 150 MiB per billing account each month.
How fast does a Cloud Run alert arrive?
Two to seven minutes after a problem starts, for a metric alert. Most metrics become visible after about 60 seconds, policy computation adds up to 5 minutes 30 seconds, and the channel adds its own delay. Google warns that delivery to SMS and Slack is not guaranteed, so start with email.
How do I lower the Cloud Run logging bill?
Turn off your own access log, because Cloud Run already writes one entry per request, then add an exclusion on the _Default sink for entries you never read, such as requests to the health path. Never exclude warnings or errors: log-based alerts do not see excluded entries.
Sources
21
- docs.cloud.google.comLogging and viewing logs in Cloud Run, Google
- docs.cloud.google.comMonitor Cloud Run performance, Google
- docs.cloud.google.comGoogle Cloud metrics P to Z, Cloud Monitoring
- cloud.google.comGoogle Cloud Observability pricing, Google
- cloud.google.comPricing examples, Google Cloud Observability
- docs.cloud.google.comConfigure log-based alerting policies, Cloud Logging, Google
- docs.cloud.google.comSample alerting policies in JSON, Cloud Monitoring, Google
- docs.cloud.google.comAlerting behavior, Cloud Monitoring, Google
- docs.cloud.google.comCreate and manage notification channels, Cloud Monitoring, Google
- docs.cloud.google.comCreate public uptime checks, Cloud Monitoring, Google
- cloud.google.comgcloud monitoring uptime create, gcloud beta monitoring channels create, gcloud logging metrics create, gcloud logging sinks update, gcloud run services logs read
- docs.cloud.google.comRouting and storage overview, Cloud Logging, Google
- docs.cloud.google.comLogExclusion, Cloud Logging API reference, Google
- docs.cloud.google.comLogging query language, Google
- docs.cloud.google.comLog-based metrics overview and counter metrics, Cloud Logging, Google
- docs.cloud.google.comCloud Logging quotas and limits, Google
- docs.cloud.google.comConfigure the Logging agent, special fields in structured payloads, Google
- docs.cloud.google.comAggregate, analyze, and view errors, Cloud Run, Google
- docs.cloud.google.comError Reporting overview, Google
- cloud.google.comCloud Run pricing, Google
- Exodus team: log volume by log name and request count of the eight services in our own project over 30 days to 2026-10-12, severities of request logs and stdout lines, and our alerting policies, read-only